
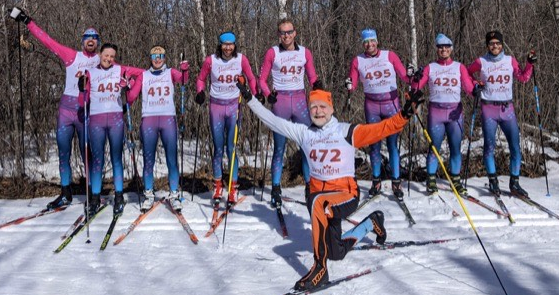
Vakava Team Photo

Vakava Team Photo
Vakava Racers at the Mora Last Chance Race

Tuesday, January 9, 2024

Training Log Analysis Part Six: Dialing in on Two “Perfect” Running Races for How I Should Train and Taper


I ran the Montreal Marathon in 2011, the Twin Cities Marathon in 2015, and a “26 km” race as part of the Blue Ox Marathon in 2017. The Montreal Marathon didn’t go well. It was hot weather and I went out too fast and suffered an epic uncharacteristic bonk. In contrast, both the Twin Cities Marathon and 26 km race were just about perfect, whereby I hit on a speedy (at least for me) pace early that I was able to maintain. I ran faster than I believed possible for both of these races, hence I know the training was really good and so was the taper. So what did I do? Well, I’m going to pull data from my Google Sheets training log and Garmin records to figure this out by making some more tables. The first is overall training.

Montreal 2011

Twin Cities 2015

Blue Ox 2017

Wk

Tot

Int

Run

RS

Tot

Int

Run

RS

Tot

Int

Run

RS

13

14

0.8

4.5

6.4

13.5

1

4.95

4.7

14.1

0.45

4.5

5.1

12

14

0.2

3.5

1.5

13.3

0.35

3.1

5.1

14

1.05

5.7

3.4

11

11.2

0.2

3.45

3.7

14.2

0.2

8.25

2.7

13.2

1

4.25

3.9

10

15

0

4

2.5

11.8

0.9

6

2.6

14.9

0.55

5.1

4.7

9

12.2

0.4

6.25

2.75

10.1

0.7

6.5

1

13.2

0.6

2.9

5.7

8

11.8

0.7

2.75

3

14.1

0.7

2.9

6.8

Backpacking

7

11.8

0.25

6.75

2

16.7

0.9

8.6

2.6

12

1.1

4.45

3.6

6

12.5

0

6.5

1.5

Backpacking

11.2

0.95

4.4

3.25

5

3

0

3

0

14.3

1.3

7.85

2.7

12.8

1.35

5.1

5.2

4

10.5

0.2

5.35

1.2

15

0.4

7.1

5.1

16

1.05

5.6

6.45

3

11.6

0

6.4

2

15.5

1

6.4

4

14.4

1.6

4.1

5.4

2

11.8

0.2

5.5

3.25

14.9

0.75

5.3

5.7

15.1

2.3

5

4

1

9.5

0

3

2

8.95

0.5

2.2

2.95

11.3

1.1

2.7

5.85

Race

Tot

149

2.95

61

31.8

162

8.7

69.2

46

162

13.1

53.8

56.6


Tot = total hours trained per week (may include biking and strength in addition to rollerskiing and running); Int = interval hours per week; run = running hours per week; RS = rollerskiing hours per week

From this chart I did 3 hours of interval training leading up to the Montreal Marathon compared to 8.7 and 13.1 for the other two races. I also did a one week backpacking trip before each of these races (4 weeks before Montreal, 6 before Twin Cities, 8 before Blue Ox). Prior to the Blue Ox race we had our Vakava camp the weekend before which accounts for such large volumes so close to the target race, including a marathon rollerski.

The next chart breaks down my longest runs and rollerskis. Average heart rates are marked in parentheses. In preparing this, it makes me want to write a letter to myself: Dear Elspeth: You are badass. 18 mile run Saturday. 18 mile classic rollerski Sunday followed by 8 mile skate rollerski.

Week before race

Montreal 2011

Long run/RS (HR)

Twin Cities 2015

Long run/RS

Blue Ox 2017

Long run/RS

13

Run 9.6 miles

Run 17 miles (134)

10 mile run


18 mile skate RS

12

Run 8 miles

Classic RS 23 miles 

(123)


Skate RS 12 miles (123)

12 mile run with 15 

minutes L3 (137,167)

11

Run 9.5 miles

Run 15 miles (138)


Run 15 miles (129)

12 mile run (127)


18.5 skate and classic 

RS with TT 

10

Run 11 miles

Run 15 miles (130)


Skate RS (130)

9 miles (132)


26.5 skate RS (127)

9

Run 13 miles

Run 19 miles (134)

12 mile run (130)


26 mile skate RS (124)

8


Skate RS 18 miles (132)


Classic RS 17 miles (118)

backpacking

7

Run 16 miles


Run 15.75 miles

Run 16.5 miles (137)


Run 15 miles (137)

10 mile (140)

6


backpacking

13 mile run with last 

mile hard


17 miles RS (134)

5

Run 17 miles

Run 18 miles (138)


Run 13.5 miles (137)

14 mile run with 14 

minutes threshold at end

 (136; 154)


28 mile skate RS

4

Run 18.6 miles

Run 22 miles (140)


15 mile classic RS (114)

16.5 miles (hot weather, 

134)


18.55 skate RS

3

Run 20.5 miles

18 mile run (131)


Skate RS 22 miles (125)

15 mile run with 1 

hour of threshold

2

Run 16.44 miles

13.5 mile run (134) 8 days before


Classic RS 18 miles 

(110)

8 days before Run 12.3 

miles (135)


1

Run 9.6 miles 6 days 

before


Run 10.4 miles 3 days 

before


RS 15.6 mile 3 days 

before

15.6 mile classic RS 

(110)

Run home from work 

6.5 miles (na)


Skate rollerski 6 days 

before, 26 miles (128)


Easy heart rates all seem high to me. Perhaps I forget that I was younger….but also I could’ve been going too hard or inaccurate readings. Previously I wore an arm band HR monitor that would always read exceptionally high for the first 10 minutes.

Long runs were fairly consistent for both marathons and obviously lower for the 26 km race. It was nice to be able to run farther than the race distance doing the shorter race.


Next I have a table detailing out my interval work. Heart rates are in parentheses again and were my max for the workout. Two numbers are given for our 5 km skate and 5 km classic time trials.

Week before race

Montreal 2011

Intervals (HR)

Twin Cities 2015

Intervals

Blue Ox

Intervals

13


5 km skate and classic 

RS TT (154,157)

Short track workout, 

longest 1 mile with 

max HR of 168


30 minutes of classic 

RS intervals (160)

12

Run L4 Intervals 3 x 4 

minutes

Run w/ sprints


Long L3 skate RS 

interval

5 km skate and classic 

RS TT (170,163)

11

Rollerski L4 Intervals 

3 x 4 minutes

Run w/ 3 x 4 min 

intervals (166)

1 km DP and skate TT 

with 2 x 20 minute L3 

(166)

10


Run 10 km pace 

workout (161)


Vakava DP intervals 

(varying length)

Run to work with 21 minutes of threshold (163)


4 x 3 minute run 

intervals (170)

9

Rollerski L4 Intervals 

3 x 4 minutes


Run L4 intervals 4 x 3 

minutes uphill

Run w/ 6 x 2 minute 

intervals (173)

Run to work w/ 24 

minute threshold (163)


Short track intervals

8


Run 6 x 5 minutes at 

goal marathon pace 

(157)


1 km DP and skate 

TT (162)

backpacking

7

Rollerski L4 intervals 

3 x 5 minutes

Run with 6 x half mile 

intervals (153)


Skate RS intervals 

4 x 8 minutes (157)

10 mile run with 20 and 

then 12 minutes of 

threshold (150 avg, 

168 max)


32 minutes of skate RS 

intervals

6


backpacking

5-4-3-2-1 minutes on 

track

5


Run w/ 2 x 20 minutes 

at L3 (159)


5 km skate and classic 

RS time trials (157,144)

13 mile run with last 

mile hard (161)


2 mile time trial on track

 (174)


6 x 7 minute L3 skate 

RS (161)

4

Run L4 intervals 4 x 3 

minutes

Run w/ 6 x half mile 

intervals (160)

4 x 3 min run intervals 

on track (167)


6 x 6 minutes classic RS 

intervals (170)

3


Run w/ 2 x 15 minutes 

L3 (149 and 155)


Classic RS intervals 

5 x 6 minutes (164)

15 mile run w/ 1 hour 

threshold (avg HR 152, 

highest 167)


5 x 4ish minutes skate 

RS intervals (167)

2

Run L4 intervals 4 x 3 

minutes

Run w/ 2 x 8 min at L3 

pace (164)


Skate RS intervals 

5 x 6 minutes (174)

8 days before 12 x 1 

minute at threshold (153)


9 days before 1 km DP 

and skate TT with other 

intervals (166)


7 days before Classic 

RS intervals, backwards ladder, about 36 minutes total (163)

1


4 days before 3 x 8 

minute classic RS 

intervals (162)

2 days before 12 x 1 

minute at threshold (145)


3 days before 3 x 4 

minute classic rollerski 

intervals (158)


Next I compiled the data by interval type:

L4 = 3-5 minutes

L3 = longer than 5 minutes

Short = 2 minutes or less

Interval Type

Twin Cities (# of sessions)

Blue Ox (# of sessions)

Run: 3-4 minute intervals

2

3

Run: less than 3 minutes

2

2

Run: 5 minutes or longer

5

5

RS: 3-4 minute intervals

1

6

RS: less than 3 minutes

0

0

RS: 5 minutes or longer

8

5

Did not include either “shake out” 12 x 1 minute before Blue Ox


Now we’re getting somewhere!

In regards to total training, my overall volumes and running time are fairly similar for all three races although more for the latter two. My interval time is markedly increased for both of the latter races with the most before the Blue Ox race.

It looks like I don’t need to taper volume until the week before; although I should ramp down on the running a bit two weeks before but OK to keep up the rollerskiing.

Looking at longest runs and rollerskis, 

  • 8 days before each race did a medium distance run
  • longest run 3 weeks before
  • medium distance run 2 weeks before
  • i.e. build to 3 weeks before (able to run race distance for Blue Ox prep as shorter)
  • did more medium rollerskis (10-20 miles) prior to Twin Cities; did some 20+ mile rollerskis prior to Blue Ox including 26 miles 6 days previous; likely affects my overall fitness but wouldn’t add more running d/t injury risk

And finally, here’s my own advice for interval prep assuming both running and rollerskiing:

  •  5 L3 sessions running
  • 2-3 L4 sessions running
  • 5-8 L3 rollerski sessions
  • 3-5 L4 sessions (interestingly did only 1 prior to Twin Cities but 8 L3’s vs 6 L4 sessions and 5 L3’s prior to Blue Ox)
  • do 2 fast running workouts with interval lengths of 2 minutes or less


If only running, would plan for intervals about twice per week alternating between L4 and faster and L5.


Thus a training plan with my critical workouts should look like this:

Week Before Race

Key distance/intervals

13

Run intervals: 1600 m, 1200 m, 800 m, 400 m, 200 m, 100 m

Rollerski 5 km time trials

12

5 x 6 minute rollerski intervals

Long rollerski

11

Run 3 x 4 minute intervals

Rollerski 2 x 18 minute intervals

10

Run interval 3 x 10 minute

Rollerski intervals 5 x 3 minutes

9

Run track intervals: 12 x 200 m

8

Run intervals 3 x 5 minutes

7

Long rollerski

Rollerski intervals 4 x 8 minutes

Run w/ 3 x 1 mile

6

Backpacking week

Long run with 2 x 15 minute L3

5

Rollerski w/ 5 km time trials

12 x 1 minute running intervals

Long run

4

Long rollerski

Rollerski 6 x 6 minutes

Run 6 x 3 minutes intervals

Longest run (if race is 16 miles or less do at least that distance; if marathon do 22 miles)

3

Long rollerski

Rollerski 5 x 4 minute intervals

15 days before medium long run (15-16 miles) with long L3 session

2

14 days before long rollerski

Rollerski (or running) intervals: 5 x 6 minutes

8 days before 13 mile run easy

1

7 days before medium-long rollerski

4 days before 3 x 4 min rollerski intervals

2-3 days before 5 mile shake out run w/ 12 x 1 minutes at L3 


So, this was obviously a lot of work and the best use I can think of for keeping a training log. Perhaps there’s a better way? I guess a couple quicker ways of doing this is to repeat what’s worked in the past or to do an L3 and L4 session each week, occasionally taking some breaks and occasionally doing some even shorter intervals.

Friday, November 17, 2023

Training Log Analysis Part Five: What 15 years of Google Sheets Data Tells Me

After a two year hiatus from analyzing my training log, I’m baaaaaack. I’ve procrastinated writing this blog because I’m not very skilled at using Google Sheets. My brother (who has a Masters in Statistics) crunched some data back in 2016 and if I remember correctly, it took him a long time and he said he wasn’t going to help me again. Hence, I had to do it myself, a really long way, the only way I know how.

I introduced my Google Sheets training log in the first series on this theme. As I noted then, I do use the data for the purpose of looking at my weekly training hours. This helps motivate me to hit my average of 12 hours a week but if I’m up to 15 hours for 2-3 weeks, it’s a reminder that I should back off some. Usually this happens naturally due to weather.

In analyzing my data, I thought adding my yearly totals would be most helpful. When I first created the spreadsheet in 2008, this was always my intention but because this data involves 365 rows, it’s much more complicated to compile than the weekly data.

Here are my training totals in hours: 


There’s a few things to note here.

Annual data is from May 1st-April 30th.

I don’t count canoeing as endurance or total hours unless I’m racing. When I’m casually canoeing my heart rate is around 80. If I’m racing, my heart rate jacks up to 120 or so, enough to count as endurance.

When I go hiking or backpacking, I usually count the time spent going uphill only.

Intervals include L3, L4, L5, and races. I haven’t delineated these out. Perhaps it would be helpful, perhaps not. I count the time I’m trying to do these intervals, regardless of my heart rate. And from my previous post, the heart rate conundrum, I’m not always hitting my target heart rate.

I’ve lumped classic and skate rollerskiing together. Prior to 2014, I exclusively skate rollerskied.

So, what is this telling me?

Let’s start from left and move right, thus we’ll begin with total training hours. It looks like on average I train around 600 hours per year. My 2012-2013 season was very light. This was because Erik and I moved back from New York, took 3+ months off from work, canoed from New York to the top of Maine (hence the high volume of canoe hours). We also spent 3 weeks hiking the John Muir Trail, none of which I counted in my endurance hours. I also clocked my lowest running and rollerki hours. I finished 30th in the classic Birkie this season but had the handicap of skiing from Wave 4, which likely put me around 10 places farther back. 


My biggest training year was 2015-2016. Incidentally this coincided with running Twin Cities Marathon. This also coincided with my best finish place in the Classic Birkie at 11th. It looks like my hours were fairly well distributed across the different training domains, but on the higher end of all.

Last year I was down almost 100 training hours compared to the previous year. Initially this surprised me, partly because I was working less, so theoretically my training should have increased. I did start volunteer high school cross-country ski coaching, albeit at most one day per week, but this may explain why my hours didn’t increase. I was relatively close in interval and strength time but significantly down on endurance time. I had more on-snow ski time compared to the previous year, about equal rollerski time, but my running was way down, likely because after a hard running interval session in early November, my posterior tibial tendonitis finally got the better of me. Hence for six months, for most of November through April, when I’m often running up to 3 hours per week, these were all zeros and likely contribute to most of the decreased hours. Interestingly enough, as I commented last year, I had lots of energy for the Mora Vasaloppet, the Finlandia, and especially the second half of the Birkie.

If I use my classic Birkie finishes, by far the largest field in which I compete and mitigating my handicap from 2013 of skiing from Wave 4, I finished in the upper teens in 2014, 2015, and 2018. Yes, my training hours were rather consistent but also seems like all that canoeing and hiking in 2013 didn’t really affect my Birkie performance.

Moving farther right, I’m going to skip over endurance which largely parallels my total training volume and next discuss interval time. I joined Vakava for the 2014-2015 season. I’m impressed to see I did more interval time on my own the year prior to joining Vakava and now have settled into around 45 hours of intervals and races, peaking in the 2021-2022 season when I didn’t feel very sharp for the Bikie. As noted above, my Birkie results are fairly consistent and I can’t draw any obvious conclusions from my interval training. 


Looking at strength is a bit erratic. I hit big hours 2010-2012 when I was a grad student and last had a gym membership. Despite all those hours, I’m pretty sure they were ineffective, lifting largely free weights working isolated muscle groups. The last couple years I’ve tried to incorporate a lot more leg strength into my routine and am hitting bigger hours again, but not even half of my max hours. I’m doing mostly multi-muscle group lifts and trying to do these with weight (pull-ups and squats) and this feels way more effective than ever before and crazily enough, I’m feeling stronger than I ever have before. How do I know this, well this summer I achieved a 20 year goal of benching my body weight, this after I hadn’t benched in 3.5 years!!!

Next I’ll move to rollerski time. I’m shocked I rollerskied a whopping 167 hours back in the 2009-2010 season, all on my OG Marwes. I’m still rocking them (got ‘em in 2004, replaced the wheels a couple times) but have mostly only been putting in 100 or so hours on rollerskis. While I think rollerskiing is good for technique and intervals, I often find that with flat terrain my heart rate is much lower than running unless I’m going uphill, hence probably not great to use as exclusive training.

I’ve broken down my ski time into classic and skate. 2011-2012 was a terrible snow winter in upstate New York and I only skied 45 hours that year! Otherwise in recent years I’ve been doing more classic than skate (except when I did the skate Birkie in 2019 and 2020). It’s interesting comparing 2018-2019 to 2019-2020. While I skied more the first year, I rollerskied more the second. My best ever classic Birkie place in 2016 was not the year of my highest ski volume, but it was near the top.


Regarding running, I ran the Twin Cities Marathon in 2015 and then got on a running kick for the next couple years. I’ve already been over last year’s low numbers. As mentioned above, my best Birkie Classic place happened the same season as Twin Cities Marathon and I had some of my highest running volume; the same did not hold true for 2018, following probably my best ever running race in 2017 and still high volume.

Most of my bike time is commuting. I almost never have my heart rate monitor on. I try not to be too lazy of a biker, but biking isn’t really my jam and I’m sitting so probably isn’t the best cardio but also feels like I’ve done some work, so I count it. I’ve heard of coaches who only let skiers count a third of their bike time and others none at all but I think this is wrong. 


Finally, my canoe hours have waxed and waned, hitting an up-tick when the pandemic started. I don’t think there’s much to learn from this to correlate with ski training, although I could be wrong.


After compiling all this data and making a bunch of graphs, I don’t find this information terribly useful, perhaps because my training has been fairly consistent over the last 10 years, similar in most part to my Birkie results. It’s also not very specific. I’m not looking at specific workouts, how long they were done before target races, my heart rates, etc. As winter approaches, fellow skiers often inquire into my training to which I respond: “oh, about like usual.” According to my analysis, that’s right. I tend to prioritize training, or at least that 12 hours a week average, no matter what else is going on in my life, and usually that’s not much:)


In my next post I’m going to focus on three running races and use more specific data and heart race analysis to drill down on optimal long running race workouts and tapering. In my last post of the series, I’ll do this again to compare my skate Birkie races from 2019 and 2020.